Refugee Data and Emigrant Crisis in 1964
- Admin Gauge
- Feb 1, 2025
- 7 min read
Mass Missing Emigrants in 1964
When I dealt with the world migration data, I noticed a very unusual phenomena around 1964. Here is the graph about the sum of migrants in the world in each year. Migrant numbers are calculated as (Immigrant Numbers) - (Emigrants Numbers). So, the sum of the all countries migrant numbers should be close to zero because a emigrant normally goes to another country and he is counted as an immigrant.
However, there are some exceptions. For example, if a person does not get a proper visa to live in a new country or he just continue traveling in several countries, maybe he is counted as an emigrant in his home country, but not counted as an immigrant in the destination country. Also, some people just keep their registration in his home country, even if he stays in another country with a special condition such as dual citizenship (no need to apply for the long term visa) etc.
So, there are such few exceptions, but normally, the sum of the migrants in the world should be close to zero. This principle is roughly valid in most years. However, there are two obvious irregular points in 1964 (mass emigration) and in 1967 (mass immigration). It seems that more than 1 million people suddenly disappeared around 1964, and then such missing people came back to the world (or in the statistics) around 1967.

Here are the sum of migrants in the world from 1963 to 1972. There are obvious down jump in 1964 and almost the same numbers of people came back to the world around 1967.
>>
1963 248545.0
1964 -1248292.0
1965 -176802.0 1966 26490.0
1967 1273808.0
1968 -232311.0
1969 -247787.0
1970 -240048.0
1971 -89294.0
1972 -50507.0
This is a table about the top countries who lost population in 1964. The top 10 countries are in China, Philippines, Russia, India, Portugal, Algeria, South Korea, Japan and Angola. However, China has exceptionally the largest number compared to other countries. The countries are somehow similar to the ones which cooperated with the Jesuit naval imperialism. However, the biggest number came from China, but not from Portugal.
The Maoism revolution happened since 1966. So, perhaps, it could be related to the preparation of the great purge by Mao. In addition, there was an assassination of Kennedy in 1963. Kennedy launched the spy satellite with Khrushchev in Soviet. And Chinese communists criticized Khrushchev as a revival of imperialism. In any case, this phenomenon happened in the context of the Cold War.
name | Country Code | 1964 |
China | CHN | -1250441.0 |
Philippines | PHL | -156342.0 |
Russia | RUS | -148595.0 |
India | IND | -141916.0 |
Portugal | PRT | -118763.0 |
Algeria | DZA | -108798.0 |
South Korea | KOR | -102284.0 |
Japan | JPN | -100696.0 |
Angola | AGO | -79977.0 |
Greece | GRC | -76678.0 |
Mexico | MEX | -72581.0 |
Turkey | TUR | -69978.0 |
Pakistan | PAK | -63298.0 |
Tunisia | TUN | -59602.0 |
Romania | ROU | -59500.0 |
Colombia | COL | -53972.0 |
Morocco | MAR | -46106.0 |
Cuba | CUB | -44406.0 |
Ghana | GHA | -43480.0 |
Spain | ESP | -41461.0 |
This is the map of the top 20 countries which lost the population in 1964.

The next map is about the immigrants in 1967 (who came back to the world). Many people came back to China, but at the same time, some of them may moved to US, Canada, Australia (Anglo-Saxon countries), Kazakhstan (the hub of the Soviet Spaceship Project - Spy Satellite), Iran and Jordan.

In any case, this kind of political immigrants are often counted as "refugees", so, let's check the refugee data by UNHCR.
World Refugee Data by UNHCR
There are two types of refugee data published by UNHCR. The one is based on the origin of the refugees, and the other is based on the country which accepted the refugees. The oldest data is in 1960, however, there were only a few countries which had/ accepted refugees at that time.
Data Source: Refugee population by country or territory of asylum | Data, Refugee population by country or territory of origin | Data
The following table is about the refugee population based on the their origin in 1960 -1968. The first country which had refugees was Angola (a central African country in the west coast). Angola is the closest country to St. Helena and Ascension islands (the spy hub of Echelon = CENTCOM). The island had been used as a spy satellite hub during WWII, and it was destroyed once. However, seemingly UNHCR started their business to help such spy pirates in 1960.
Country Name | 1960 | 1961 | 1962 | 1963 | 1964 | 1965 | 1966 | 1967 | 1968 |
China | NaN | NaN | NaN | NaN | 1200000.0 | 1330000.0 | 1326810.0 | 74000.0 | 70000.0 |
Angola | 150000.0 | 150000.0 | 170000.0 | 175000.0 | 200000.0 | 220000.0 | 303800.0 | 356200.0 | 381360.0 |
Rwanda | NaN | 147000.0 | 147000.0 | 154000.0 | 166300.0 | 155900.0 | 159600.0 | 160230.0 | 160100.0 |
Sudan | NaN | NaN | NaN | 13000.0 | 20300.0 | 81560.0 | 115000.0 | 120990.0 | 175500.0 |
Guinea-Bissau | NaN | NaN | NaN | 6000.0 | 30000.0 | 50000.0 | 61050.0 | 59520.0 | 56740.0 |
In the first 5 years (1960 - 1964), UNHCR mostly helped the refugees (maybe the remains of war criminals who worked in the imperial navy). And then, suddenly there were 1200000 refugees appeared in 1964. It accords with the migrant data by World Bank. And the Chinese refugees increased until 1966, however, the number suddenly decreased to 74000 in 1967. To assume their destination, let's check the statistics about recipient countries.
The table below is the refugee data based on the territory of asylum (=the countries which received the refugees)in 1960-1963. It is sorted by the values of 1960.
You can easily find the origin of the "Palestine" refugees here, especially in Jordan and West Bank/ Gaza. Also, there are two major issues in this data. First, the refugee acceptance numbers in 1960 is much bigger than the refugee numbers in the data based on their origin. I mean that in the first table, only Angola (as the origin of the refugees) has refugees (150000), however, the following table shows other kind of refugees which amount to 2641151. So, there is a obvious gap (about 2500000). In 1960, positive numbers were found only in 23 countries (until Tunisia in the table below). Assumingly, these people are the war criminals of WWII who were purged by the post war liberals.
The second issue is that US, France, Germany (maybe only "West" Germany), UK, Belgium, Canada, Austria, Sweden, Switzerland, Greece, Italy, Netherland kind of western countries accepted such refugees a lot. However, the countries under military regime (Spain and Portugal) did not accept them. Of course, none of Soviet states accepted them. So, it is likely that the countries which accepted the "refugees" were on the side of the war criminals.
Country Name | Country Code | 1960 | 1961 | 1962 | 1963 |
Jordan | JOR | 623660.0 | 633197.0 | 644940.0 | 662525.0 |
United States | USA | 500000.0 | 500000.0 | 500000.0 | 500000.0 |
West Bank and Gaza | PSE | 258165.0 | 265430.0 | 273038.0 | 283782.0 |
France | FRA | 245935.0 | 253375.0 | 259740.0 | 174057.0 |
Germany | DEU | 197000.0 | 190000.0 | 185000.0 | 182000.0 |
United Kingdom | GBR | 167000.0 | 164000.0 | 160000.0 | 157000.0 |
Congo, Dem. Rep. | COD | 150000.0 | 203000.0 | 223000.0 | 237000.0 |
Lebanon | LBN | 137884.0 | 142670.0 | 146969.0 | 152747.0 |
Syrian Arab Republic | SYR | 116778.0 | 120577.0 | 124626.0 | 129010.0 |
Belgium | BEL | 55000.0 | 53000.0 | 51000.0 | 50000.0 |
Canada | CAN | 48629.0 | 44492.0 | 12282.0 | 10946.0 |
Austria | AUT | 39000.0 | 34000.0 | 30000.0 | 27000.0 |
Sweden | SWE | 26000.0 | 26000.0 | 26000.0 | 26000.0 |
Switzerland | CHE | 20000.0 | 20000.0 | 20000.0 | 20000.0 |
Greece | GRC | 15500.0 | 15200.0 | 15700.0 | 15400.0 |
Italy | ITA | 15500.0 | 14500.0 | 14300.0 | 14600.0 |
Netherlands | NLD | 12000.0 | 10000.0 | 10000.0 | 9500.0 |
Norway | NOR | 3000.0 | 3000.0 | 3000.0 | 3000.0 |
Morocco | MAR | 2700.0 | 2900.0 | 2900.0 | 3200.0 |
Denmark | DNK | 2300.0 | 2200.0 | 2200.0 | 2200.0 |
Turkiye | TUR | 2200.0 | 2300.0 | 2300.0 | 2300.0 |
Luxembourg | LUX | 1900.0 | 1900.0 | 1900.0 | 1900.0 |
Tunisia | TUN | 1000.0 | 1000.0 | 1000.0 | 1000.0 |
Hong Kong SAR, China | HKG | NaN | NaN | NaN | NaN |
Destination of the Missing Chinese Refugees
In any case, let's back to the missing Chinese refugees in 1964. The next table is about the top refugee recipient countries (sorted by the value of 1966).
df_rec = df_rec.sort_values(by = "1966", ascending = False)

df_rec[["Country Name", "Country Code", "1963", "1964", "1965", "1966", "1967", "1968"]].head(30)
You can easily find that the missing 120000+ were likely to have moved to Hong Kong and Macao. At that time, Hong Kong and Macao were still functioned as the penal colonies of Jesuits or British colonists, and they were segregated by the mainland China. And then, the 1200000+ people suddenly disappeared in 1967. Perhaps, such people were killed during the Maoism revolution because the total refugee numbers in the world dramatically decreased between 1966-1967. (the line chart below)
Country Name | Country Code | 1963 | 1964 | 1965 | 1966 | 1967 | 1968 |
Hong Kong SAR, China | HKG | 0.0 | 1120000.0 | 1251200.0 | 1250040.0 | 0.0 | 0.0 |
Jordan | JOR | 662525.0 | 678985.0 | 697658.0 | 714763.0 | 668453.0 | 478369.0 |
United States | USA | 500000.0 | 500000.0 | 510000.0 | 500000.0 | 480000.0 | 498000.0 |
Congo, Dem. Rep. | COD | 237000.0 | 236000.0 | 265000.0 | 357100.0 | 434100.0 | 475400.0 |
West Bank and Gaza | PSE | 283782.0 | 293024.0 | 301879.0 | 311846.0 | 295040.0 | 576889.0 |
France | FRA | 174057.0 | 175861.0 | 177665.0 | 179468.0 | 177200.0 | 176736.0 |
United Kingdom | GBR | 157000.0 | 160000.0 | 170000.0 | 167000.0 | 164000.0 | 161000.0 |
Lebanon | LBN | 152747.0 | 158584.0 | 163069.0 | 164692.0 | 122967.0 | 173437.0 |
Uganda | UGA | 59000.0 | 113000.0 | 137400.0 | 156000.0 | 162760.0 | 175730.0 |
Syrian Arab Republic | SYR | 129010.0 | 133366.0 | 138081.0 | 142206.0 | 127304.0 | 151730.0 |
Germany | DEU | 182000.0 | 180000.0 | 180000.0 | 140000.0 | 112000.0 | 110000.0 |
Burundi | BDI | 34000.0 | 78000.0 | 65000.0 | 79000.0 | 79000.0 | 72200.0 |
Macao SAR, China | MAC | 0.0 | 80000.0 | 80000.0 | 73770.0 | 74000.0 | 70000.0 |
Senegal | SEN | 6000.0 | 30000.0 | 50000.0 | 61400.0 | 59870.0 | 57210.0 |
India | IND | 0.0 | 44000.0 | 45000.0 | 45000.0 | 50000.0 | 55000.0 |
Central African Republic | CAF | 0.0 | 3300.0 | 20560.0 | 43000.0 | 35000.0 | 23000.0 |
Australia | AUS | 0.0 | 0.0 | 40000.0 | 40000.0 | 44000.0 | 43000.0 |
Belgium | BEL | 50000.0 | 47000.0 | 47000.0 | 40000.0 | 34000.0 | 33000.0 |
Tanzania | TZA | 12000.0 | 25000.0 | 29000.0 | 33950.0 | 39800.0 | 46000.0 |
Serbia | SRB | 0.0 | 0.0 | 25820.0 | 26100.0 | 26210.0 | 26270.0 |

Also, there are possibilities that some of such Chinese refugees exiled to countries which has bigger number in 1967 than 1966. Here is the list of the countries which experienced the increase of refugees during 1966-1967. It is quite similar to the first mission of CENTCOM (around Sudan).

Country Name | Country Code | gap btw 1966-1967 |
Congo, Dem. Rep. | COD | 77000.0 |
Sudan | SDN | 33000.0 |
Uganda | UGA | 6760.0 |
Tanzania | TZA | 5850.0 |
India | IND | 5000.0 |
Zambia | ZMB | 4420.0 |
Australia | AUS | 4000.0 |
Cambodia | KHM | 3000.0 |
New Zealand | NZL | 3000.0 |
Spain | ESP | 3000.0 |
Morocco | MAR | 820.0 |
Switzerland | CHE | 500.0 |
Macao SAR, China | MAC | 230.0 |
Nepal | NPL | 180.0 |
Serbia | SRB | 110.0 |
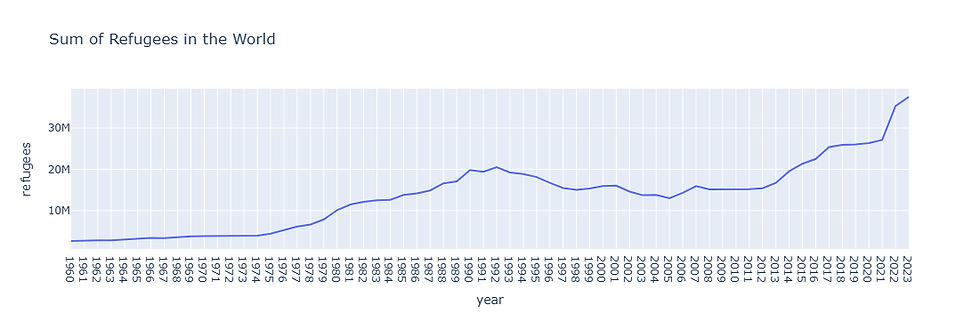
Global Sum of Refugee Numbers since 1960
This is the line chart about global sum of refugee numbers since 1960. The numbers of refugees (mostly related to the past war criminals) accepted in all countries became 37.57 million in 2023. Roughly speaking, it became 14 times bigger than that in 1960.
Also, there was an obvious decline of the refugee acceptance around 1991, the year of the fall of Soviet. It implies that some of such war criminal refugees found places to live normally, without refugee states. However, the world restarted to reject them since around 2013 (Arab Spring or Syrian War). And the number of refugees (related to war criminals of WWII or Jesuits), resumed to increase.
It has become a very long article. Next time, I will analyze the detail of the mobility of the refugees in each decades.


Comments